

The class involves two or three projects where students translate complex and messy content—such as scientific concepts, processes, emotions—into valuable and meaningful information. Each project introduces a new information design challenge, aims at specific target audiences (undergraduate students, high school students, clients investors or University faculty and staff), involves different formats and sizes (posters, booklets, decks), and adds various constraints (working by hand, using a reduced number of colors, working digitally). At the beginning of each project, in-class exercises focus on practicing a specific component (design pages) or introduce a new concept (visual composition).
These are six projects that students have completed in previous semesters:
Project 1: You, Me & The Class (Poster)
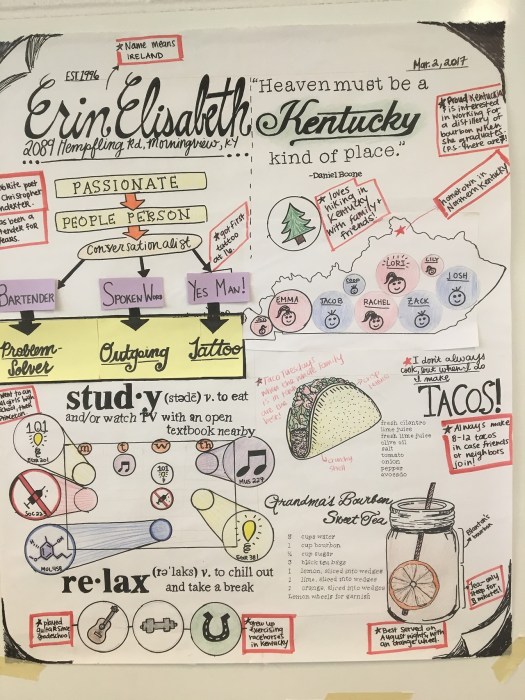
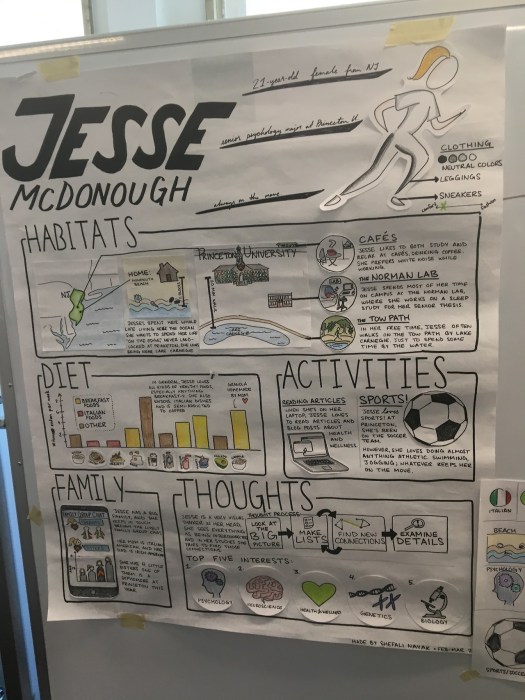
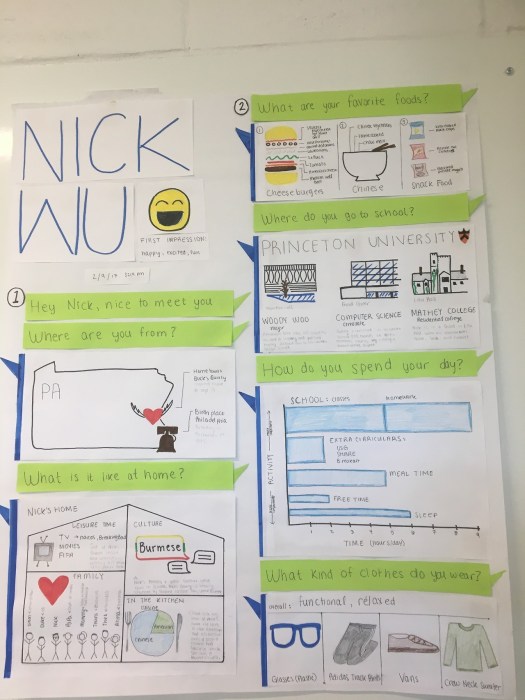
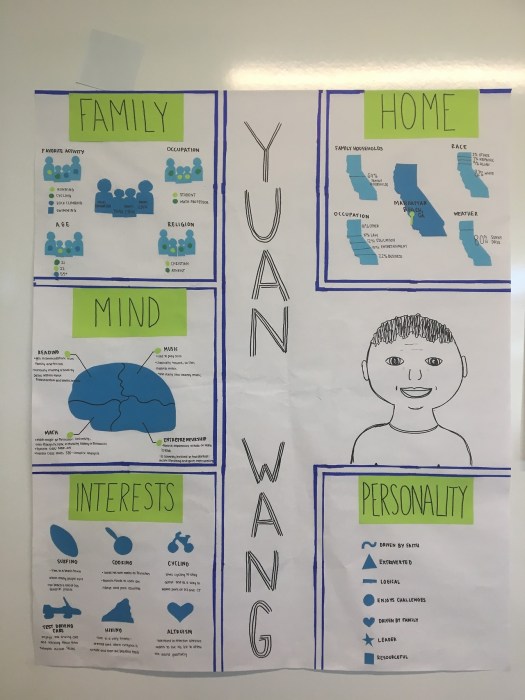
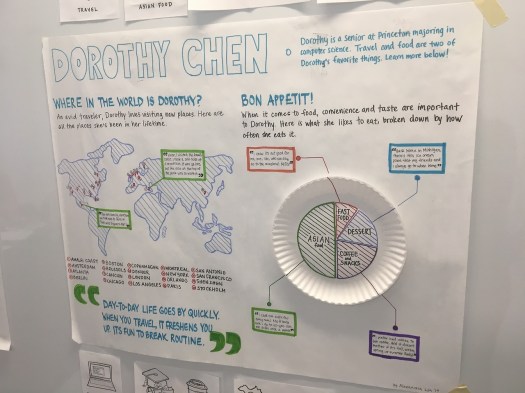
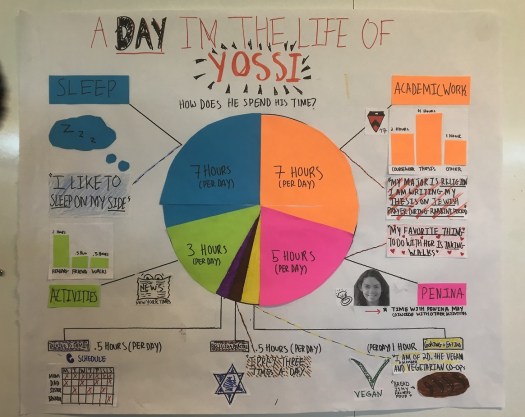
Students explore creative ways to visually communicate and introduce a classmate to the class and describe how the class is composed (Who is in the class?). Through interviewing and observing, students gather data (e.g. family members, age, number of coffees drunk per day) and facts (e.g. hobbies, favorite meals) first from a classmate, and then from the class (e.g. students wearing glasses, students with blue eyes). After students have collected data, they analyzed and synthesized it to define a structure and translate the main story into visual form. Final posters are handmade.
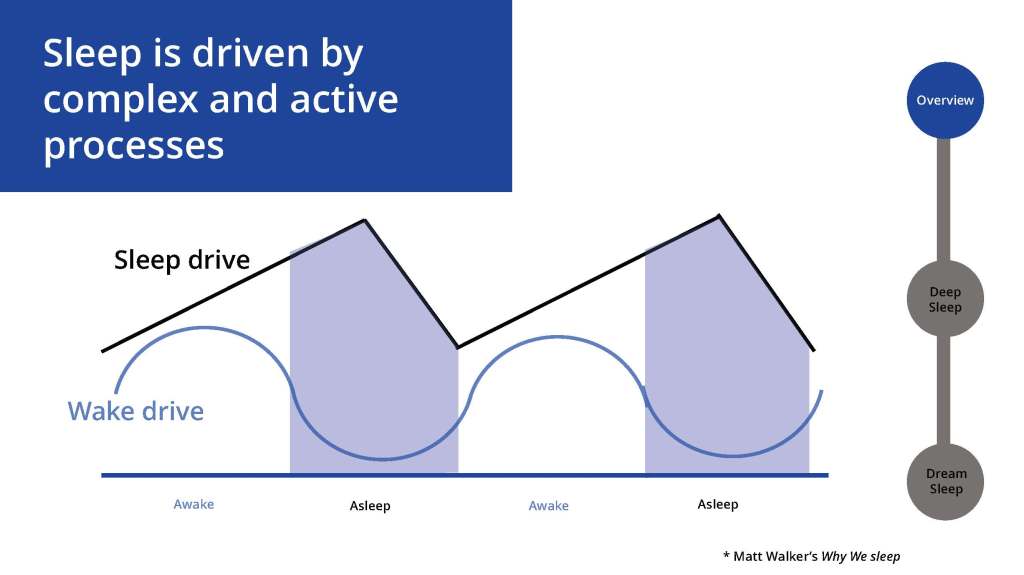
Project 2: Understanding Complexity (Poster)
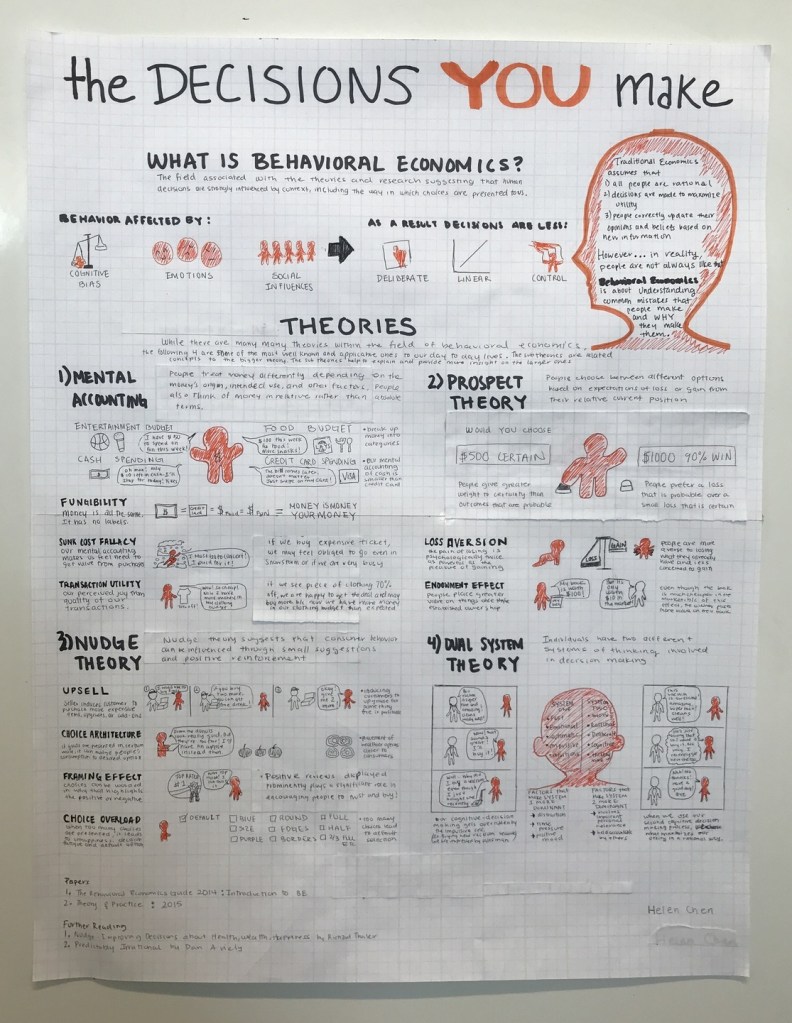
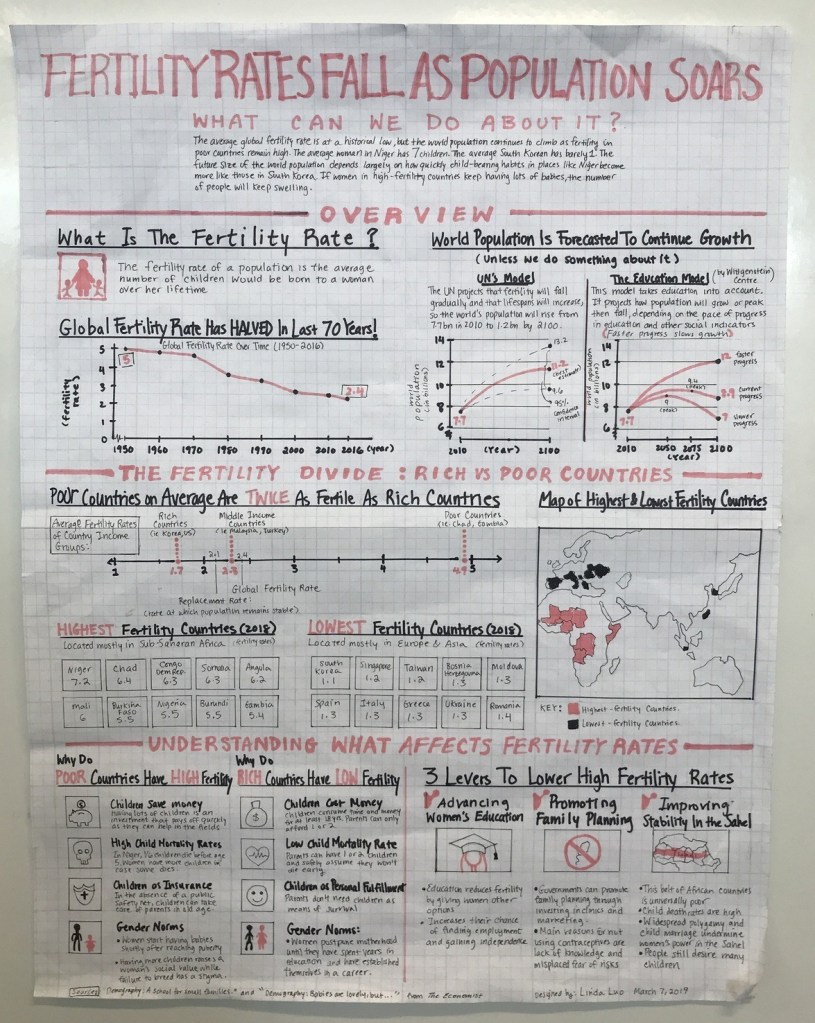
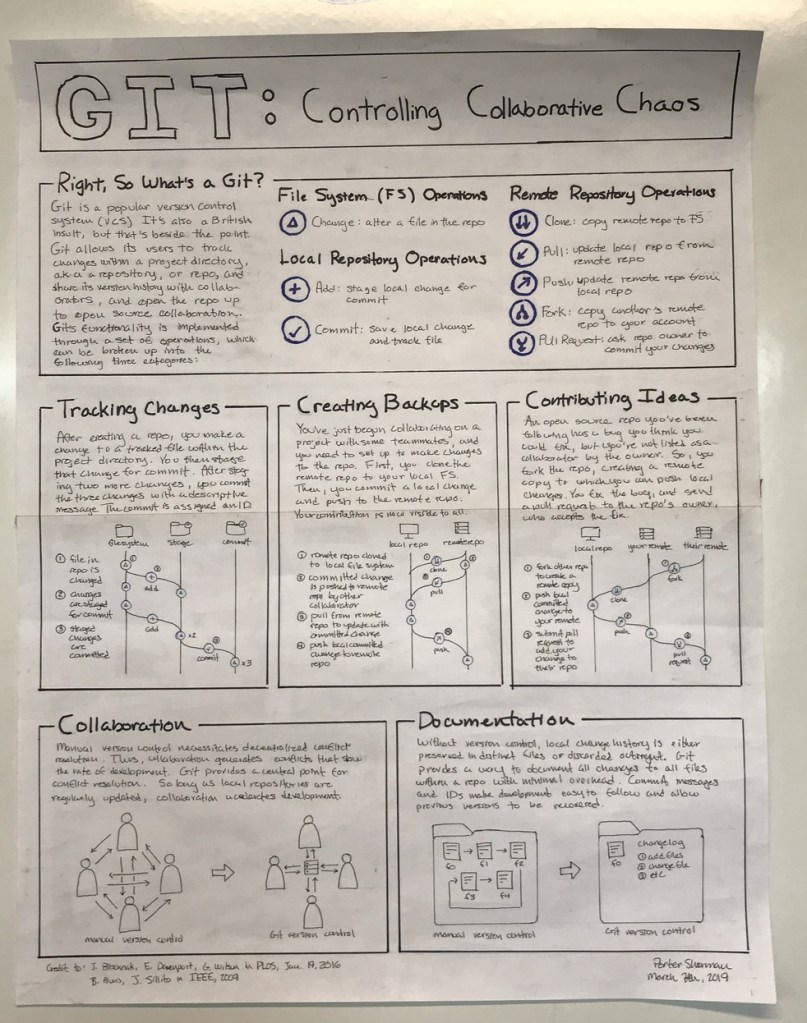
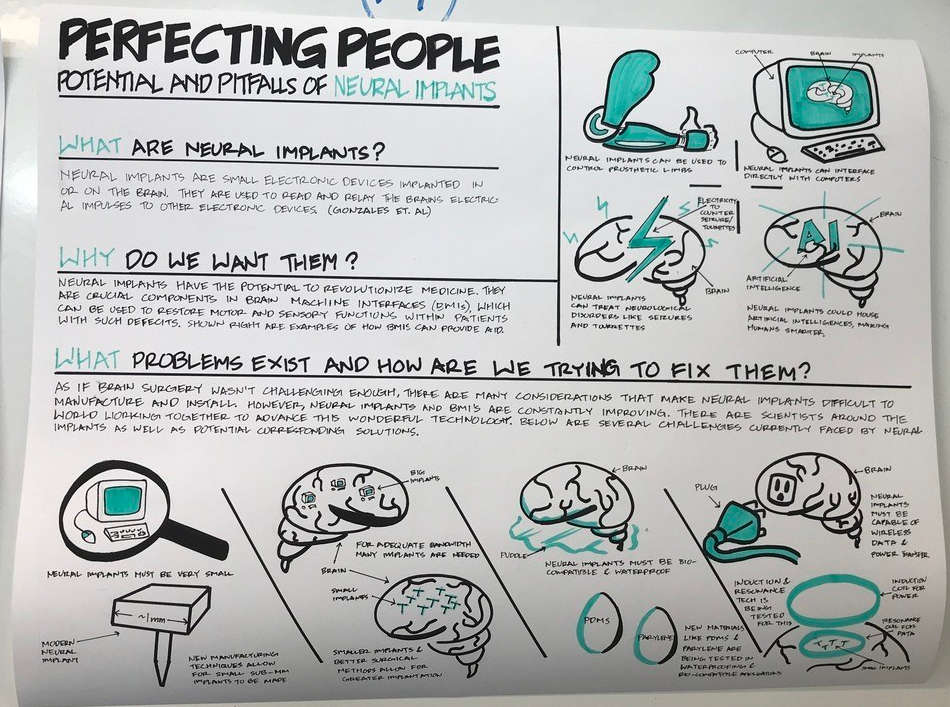
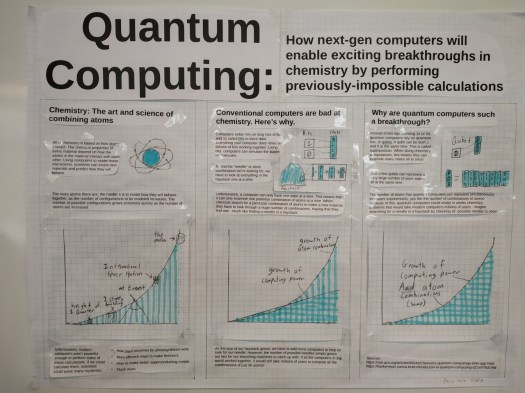
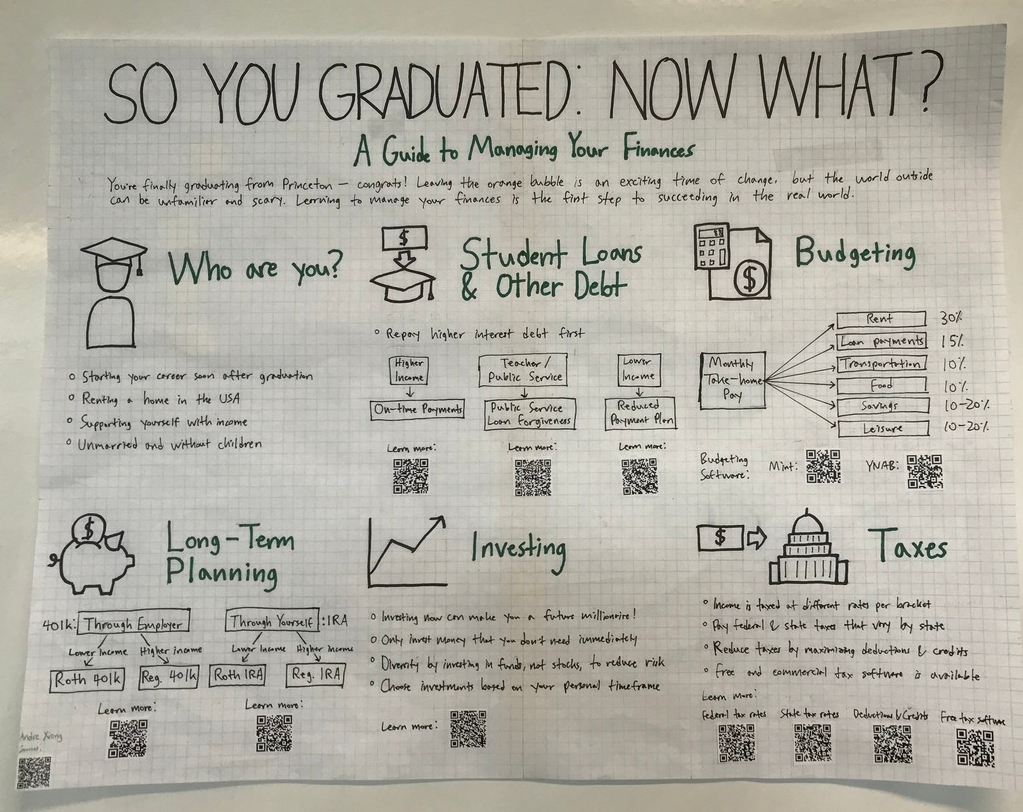
Working individually, students create a standalone poster to visually summarize, communicate and explain to the class a complex concept or story of their choice. Students extract content from two journal papers or articles about a same topic but from different sources. Students can only use black, white and one color . This project is made by hand, but they can print out text.
Project 3: Understanding Organizations (Poster)
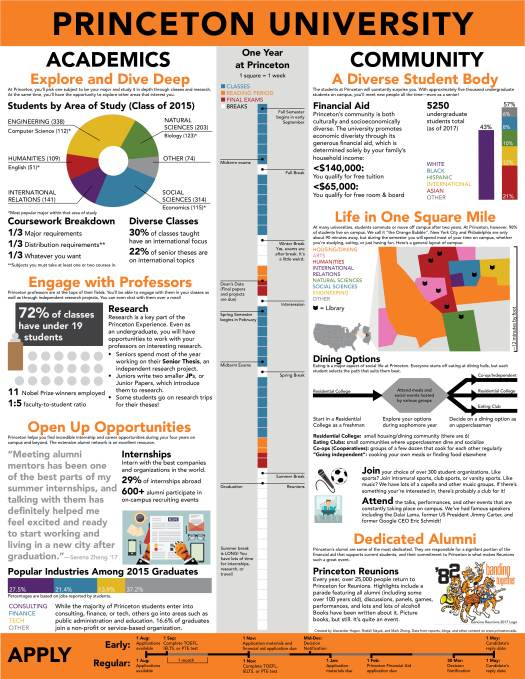
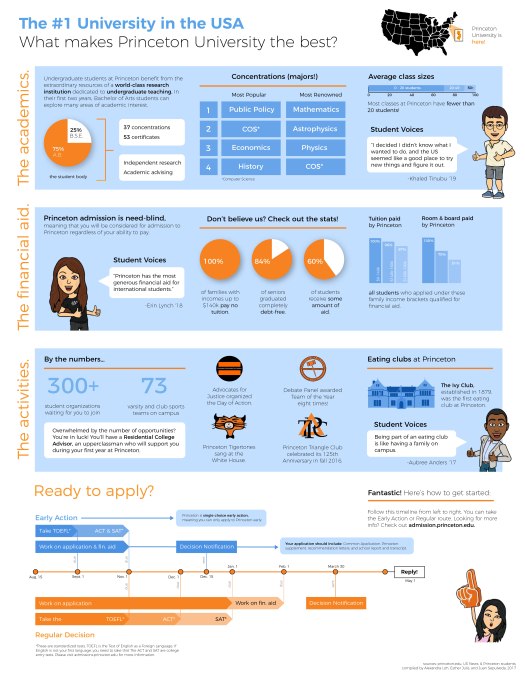
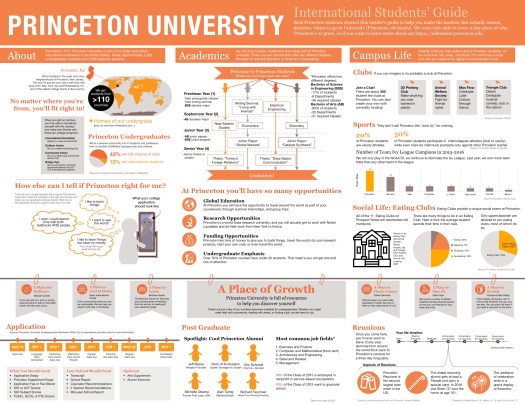
Working on teams of 3 or 4, students create poster explaining how Princeton University is organized in order to help Paul and Sandra, two foreign students, make a decision about their future education. They both speak English but are not Americans. They are trying to decide which Ivy League universities they should apply to, but for them making this decision is hard because they do not understand how Princeton University is organized and what studying here would look like. Students interview other students, staff members and professors to gain a better understanding of how the university works before starting to thinking about the design. First drafts and initial assumptions are tested when the intended audience comes to class and provides feedback.
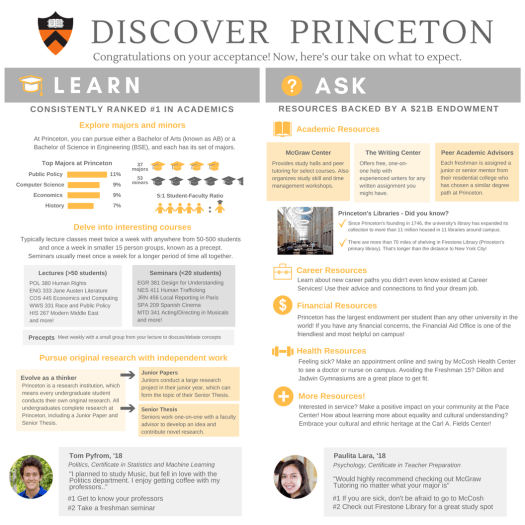
Project 4: Visual Narrative (Booklet)
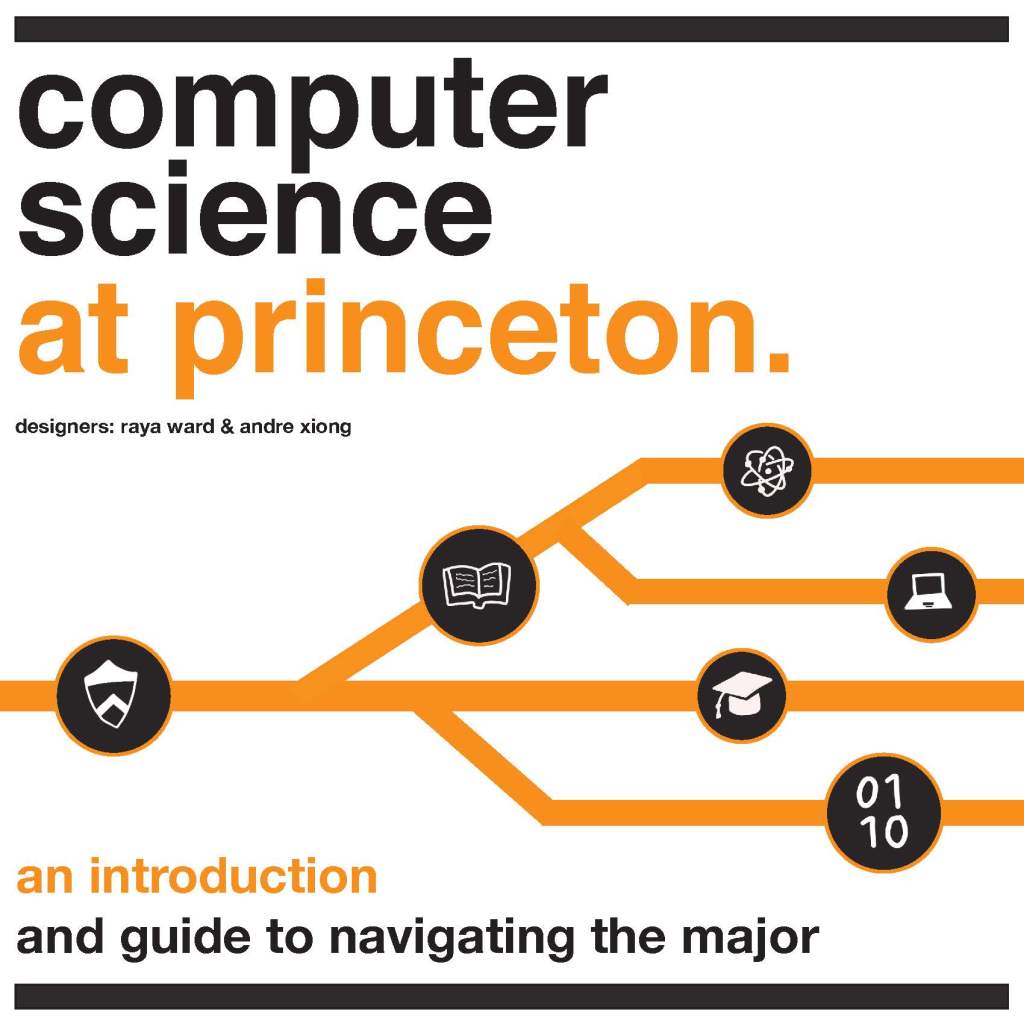
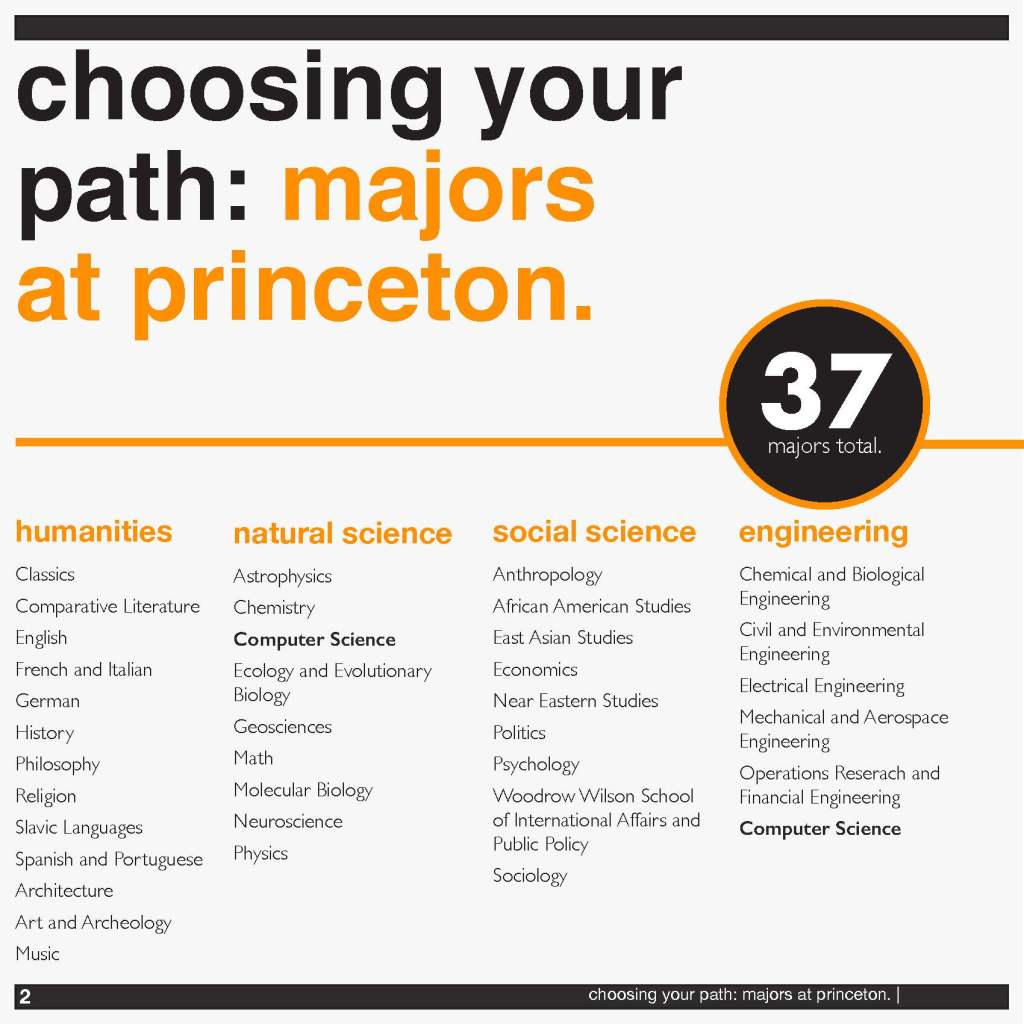
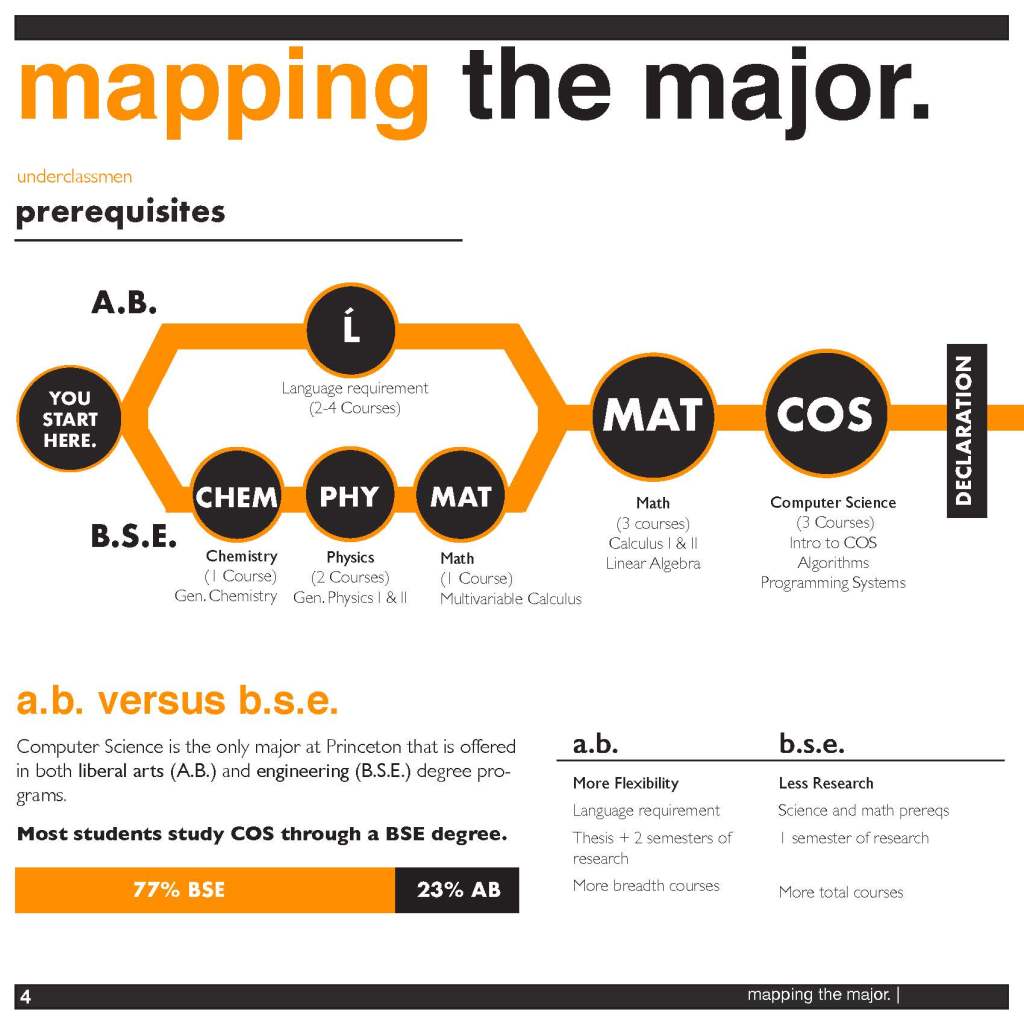
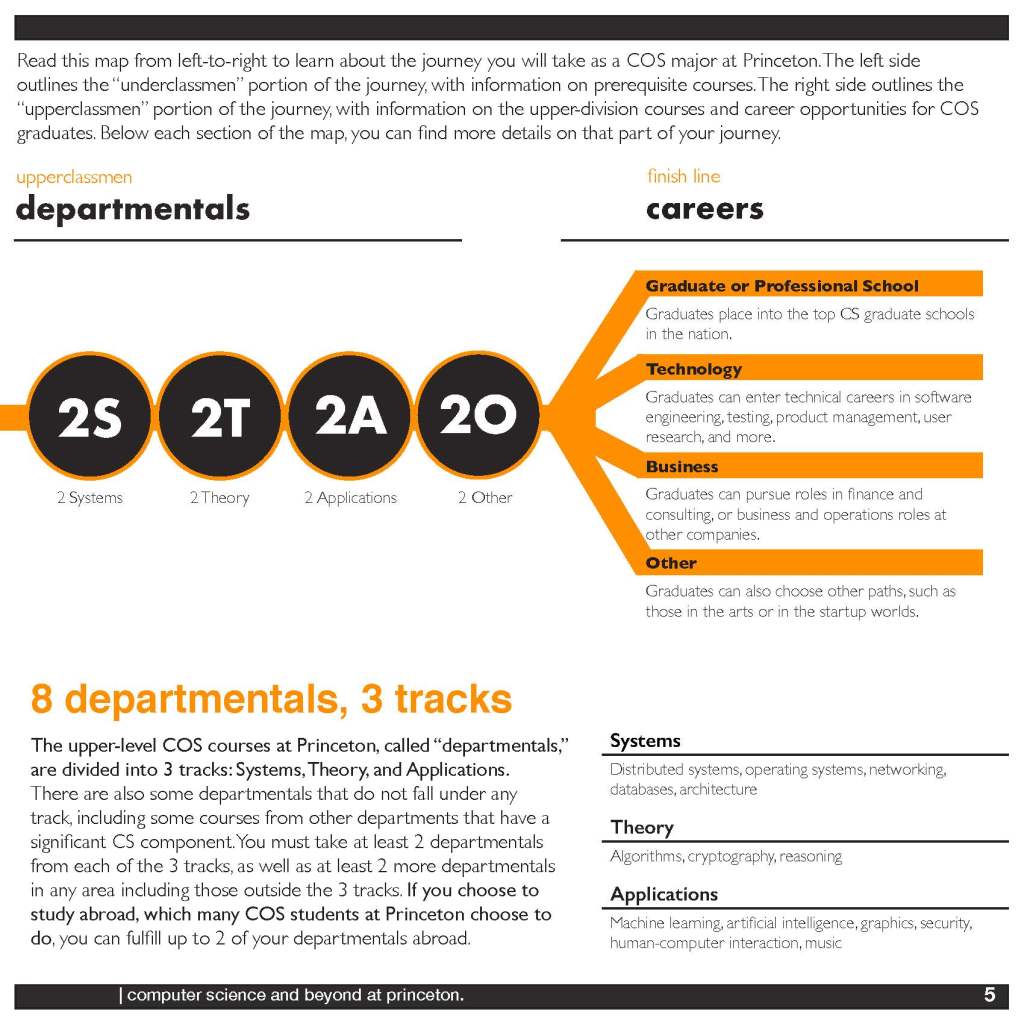

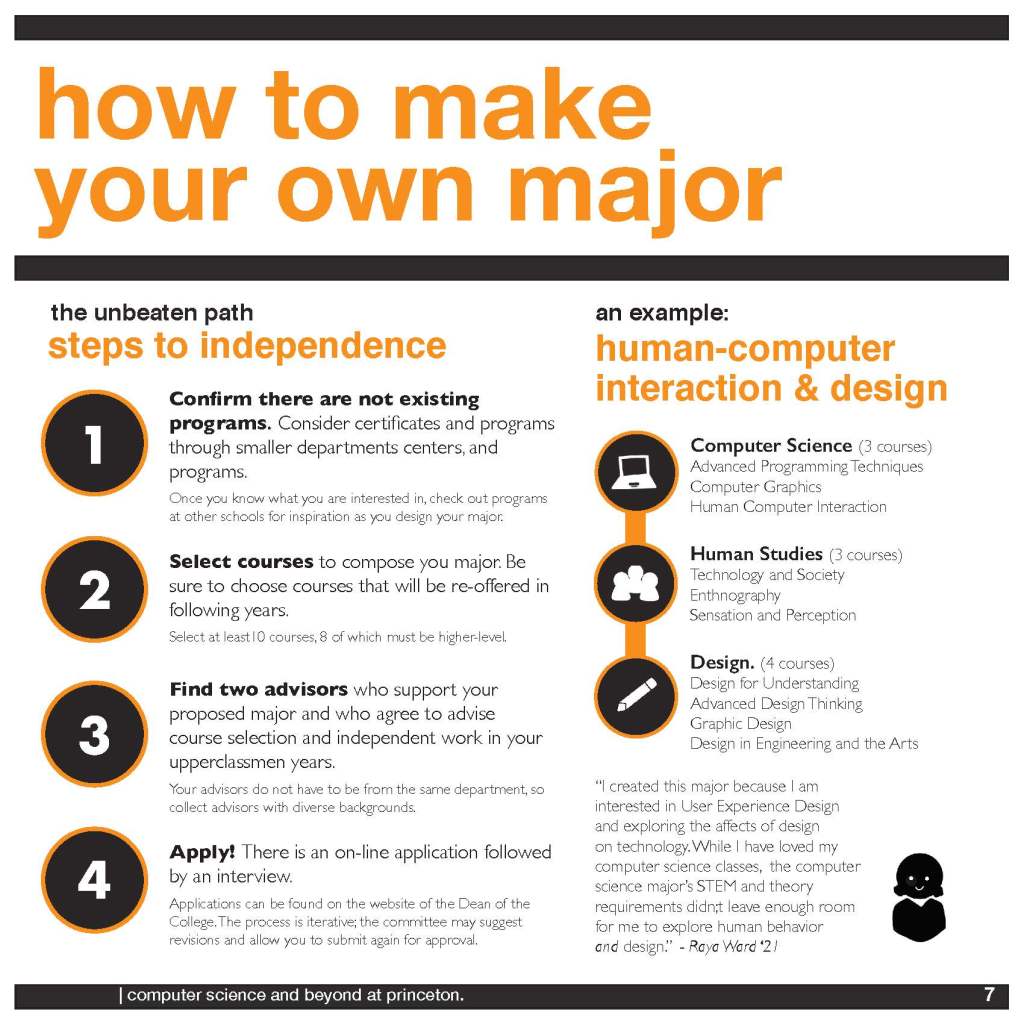
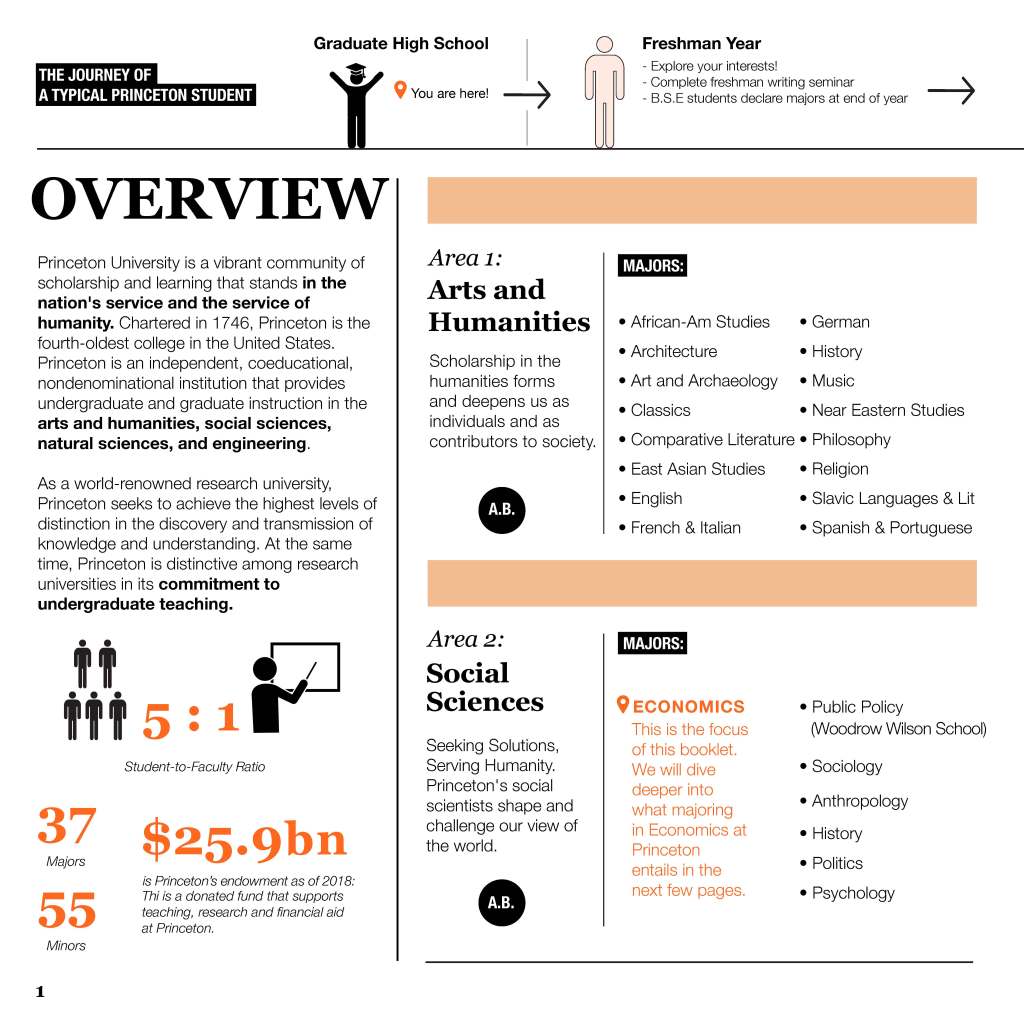
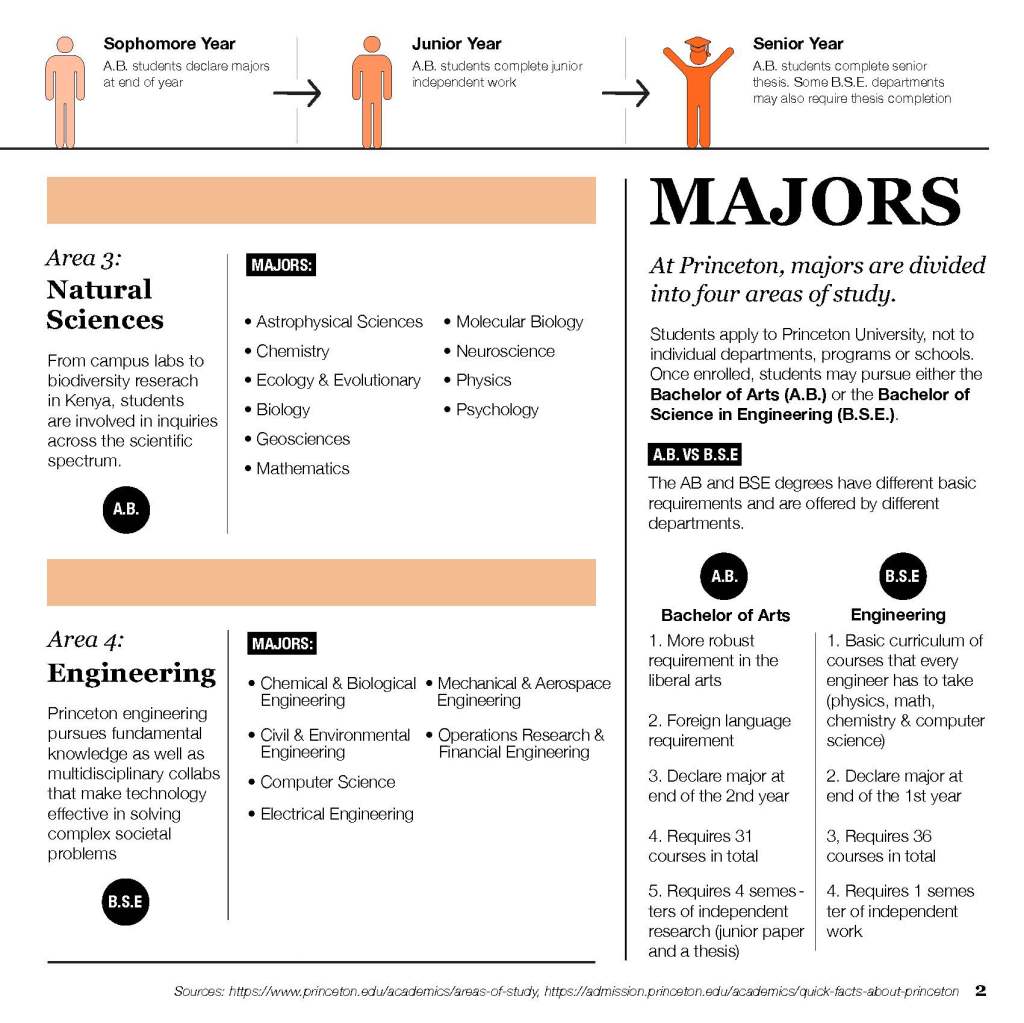
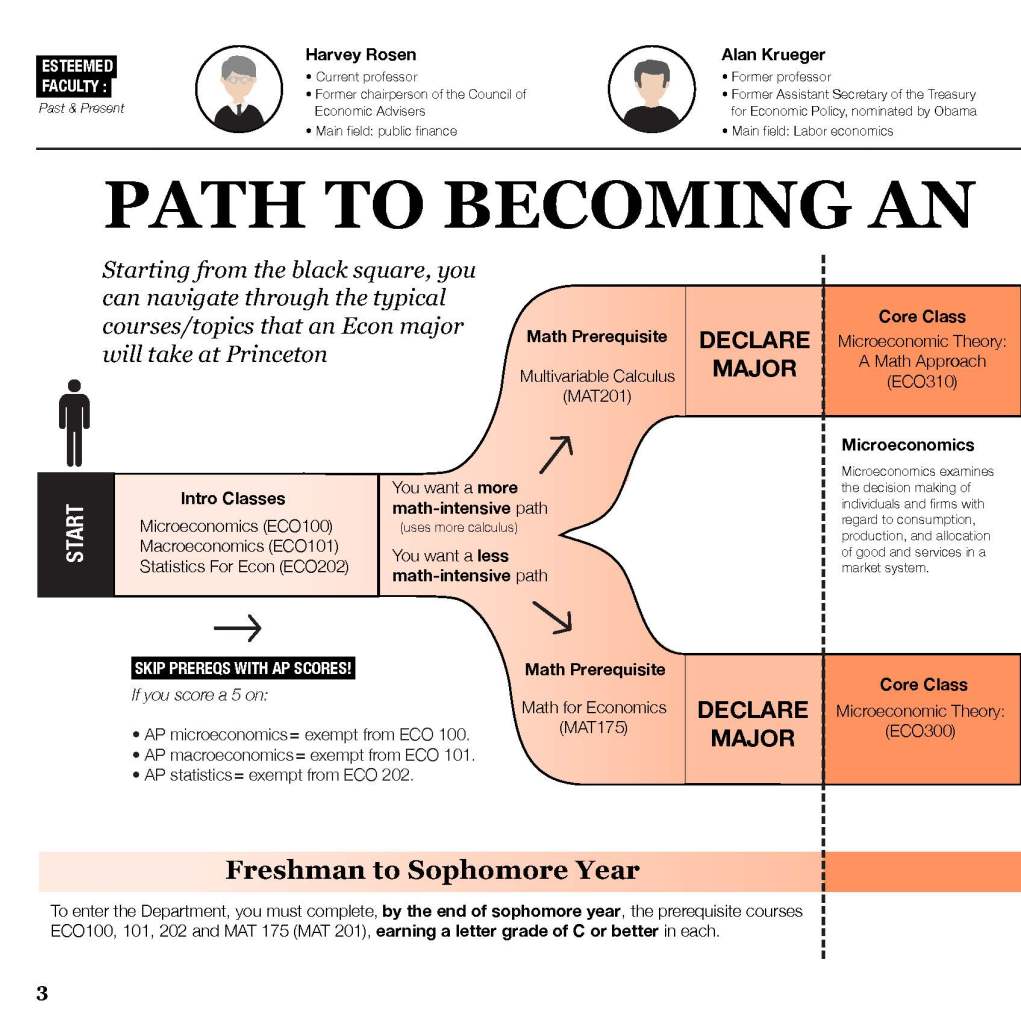
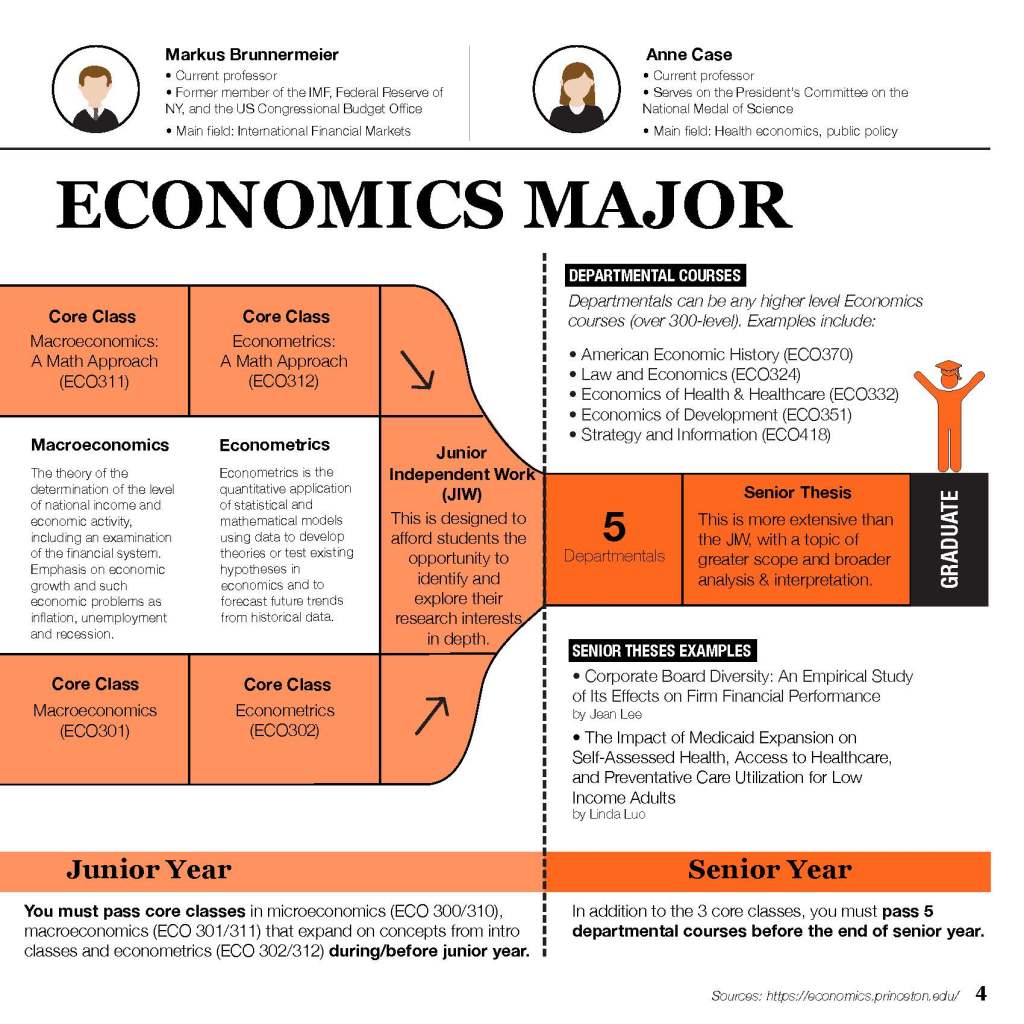
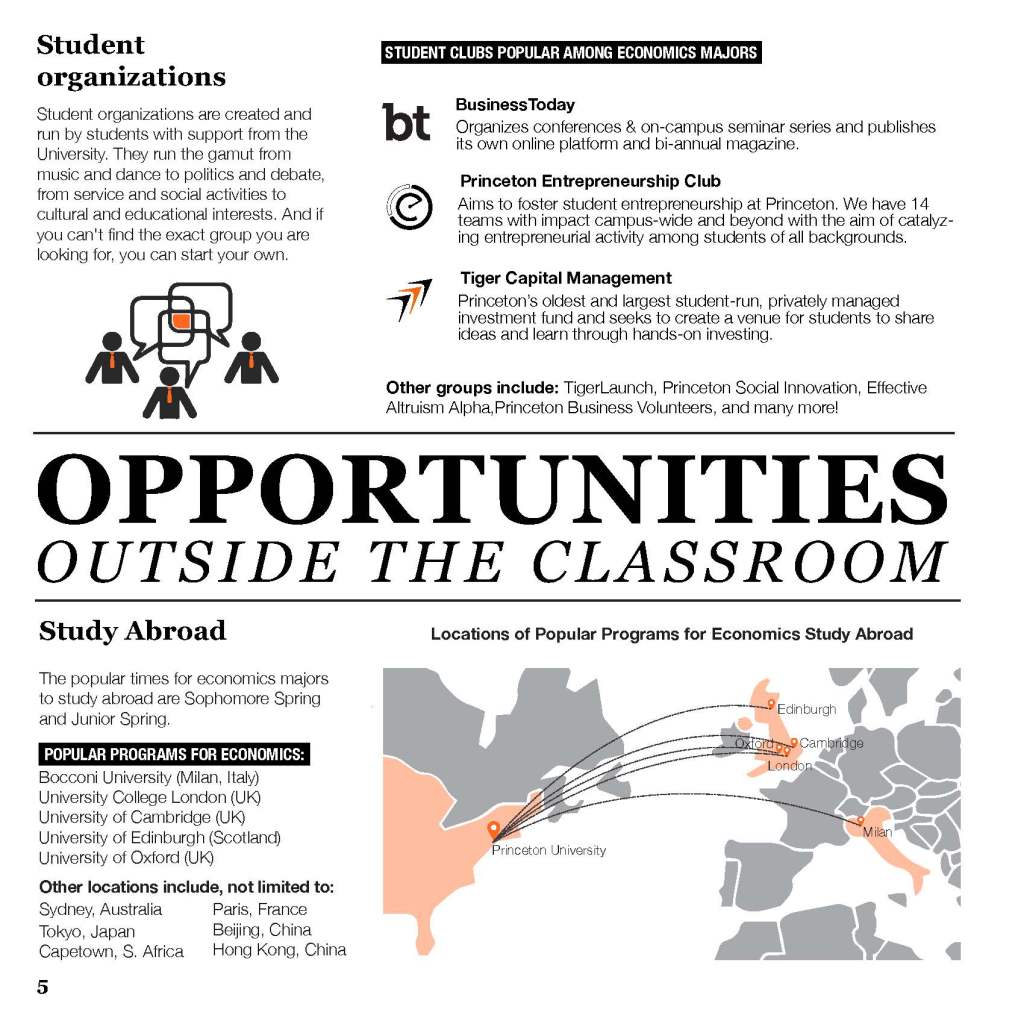
Paul and Sandra are two high-school students trying to decide whether to apply for Princeton University, but they do not know what possible majors are offered and what each path involves (e.g. courses, topics, etc.). Working with a partner, create an 8-page booklet that helps Paul and Sandra better understand the range of majors offered at Princeton University, and focuses on one of them in detail. This means that you and your team member will be “the content experts”.
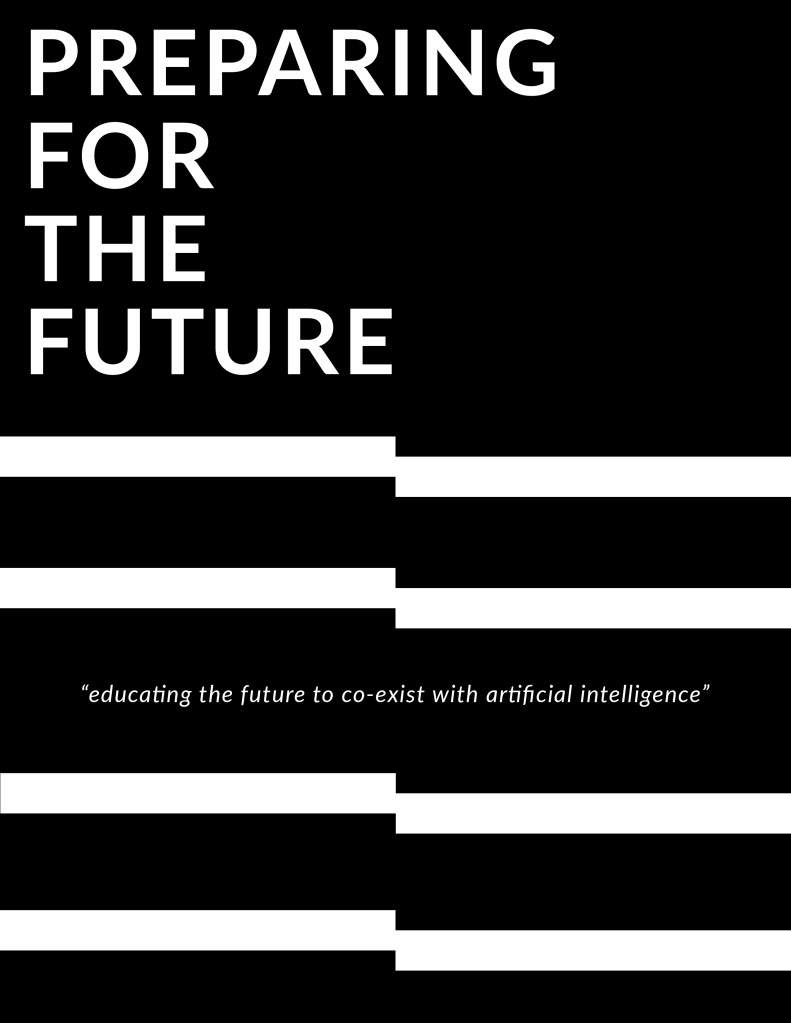
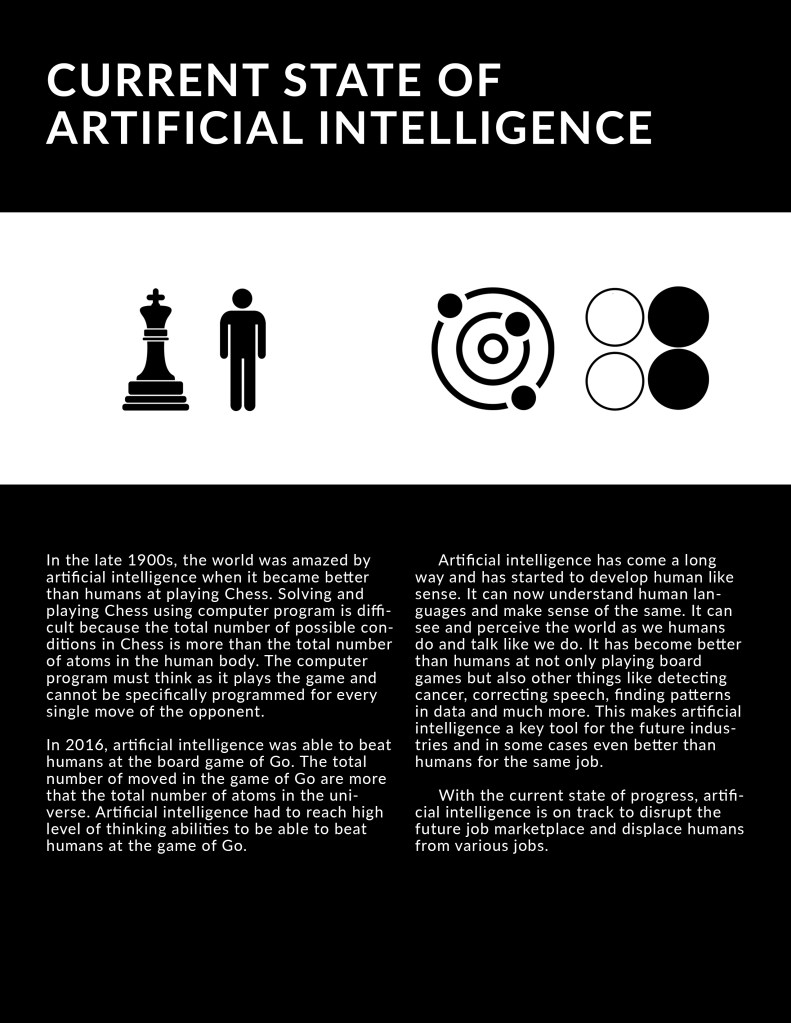
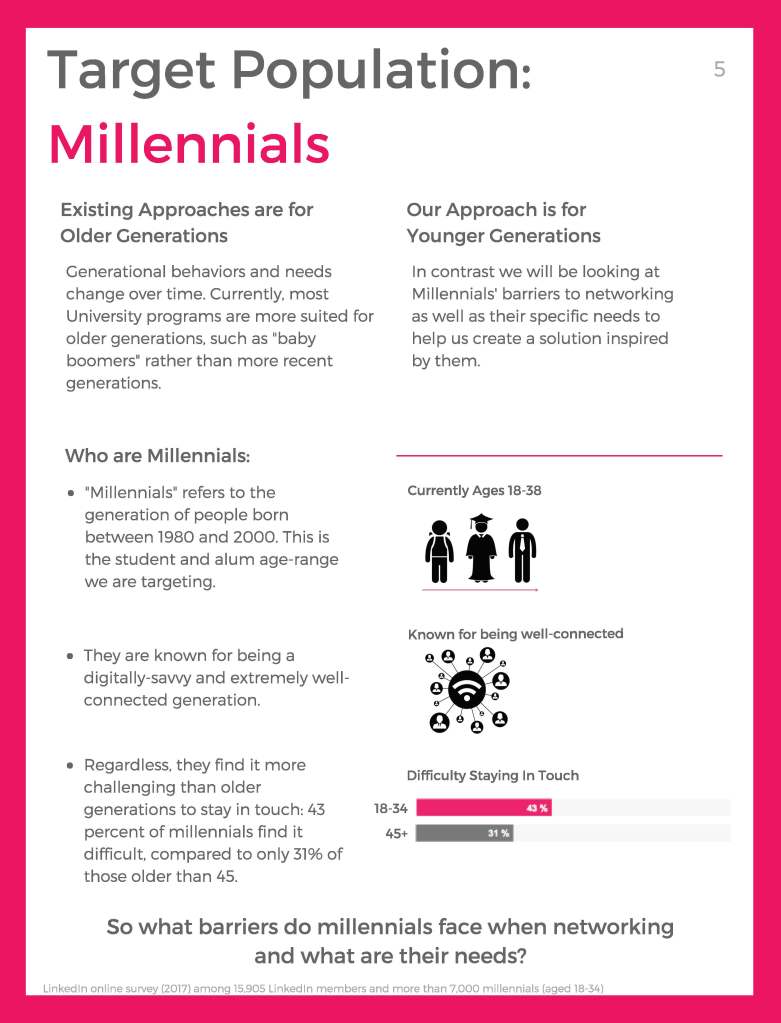
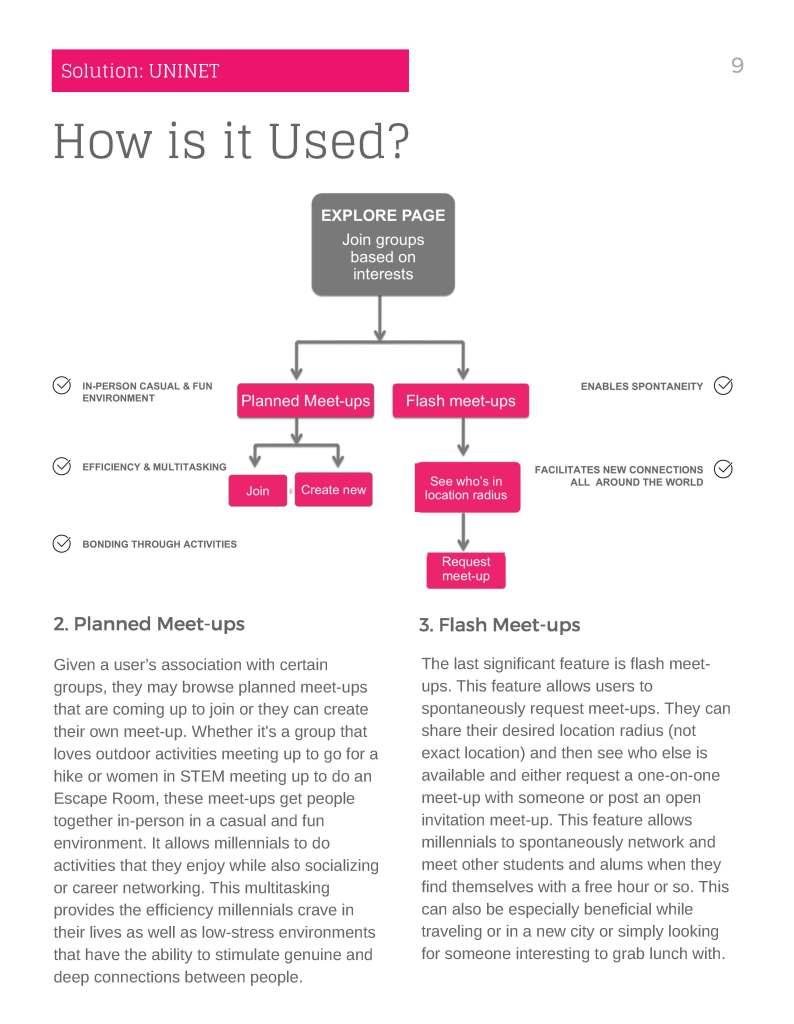
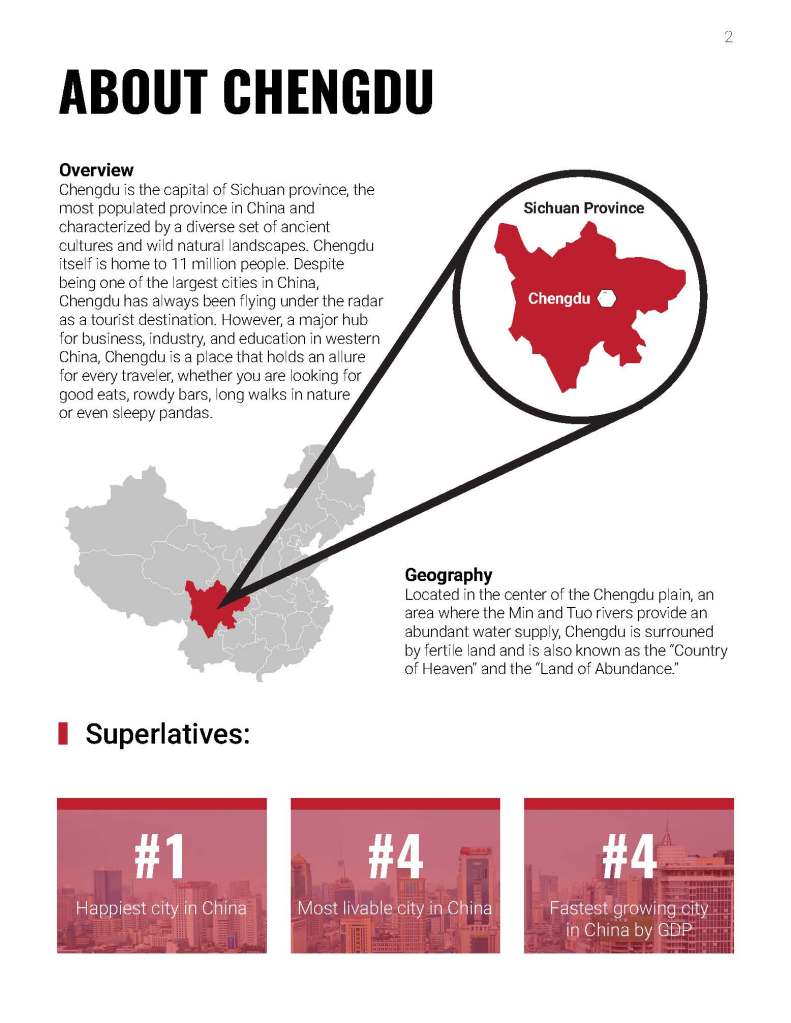
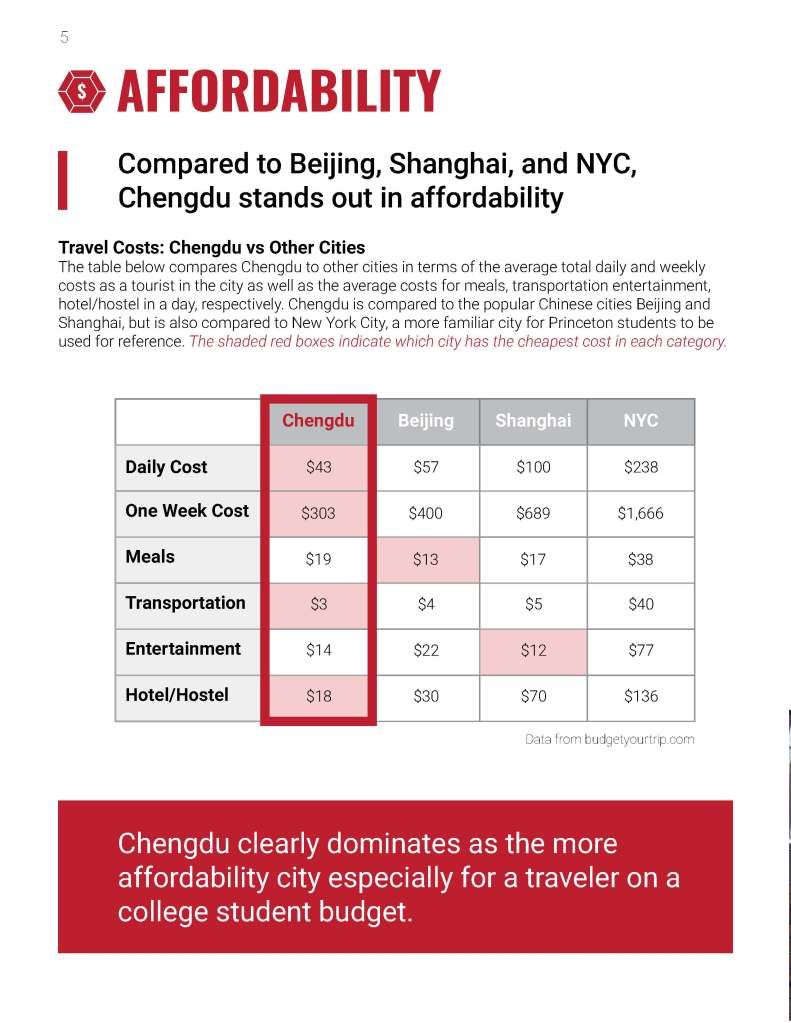
Project 5: Explaining With Data (Deck)
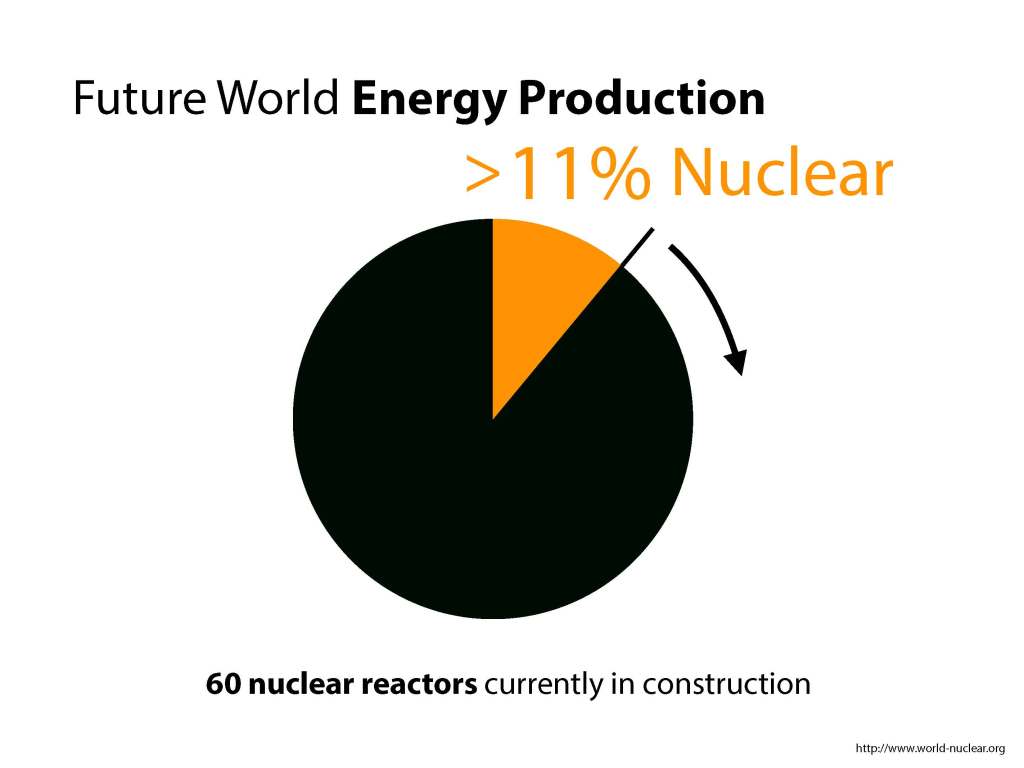
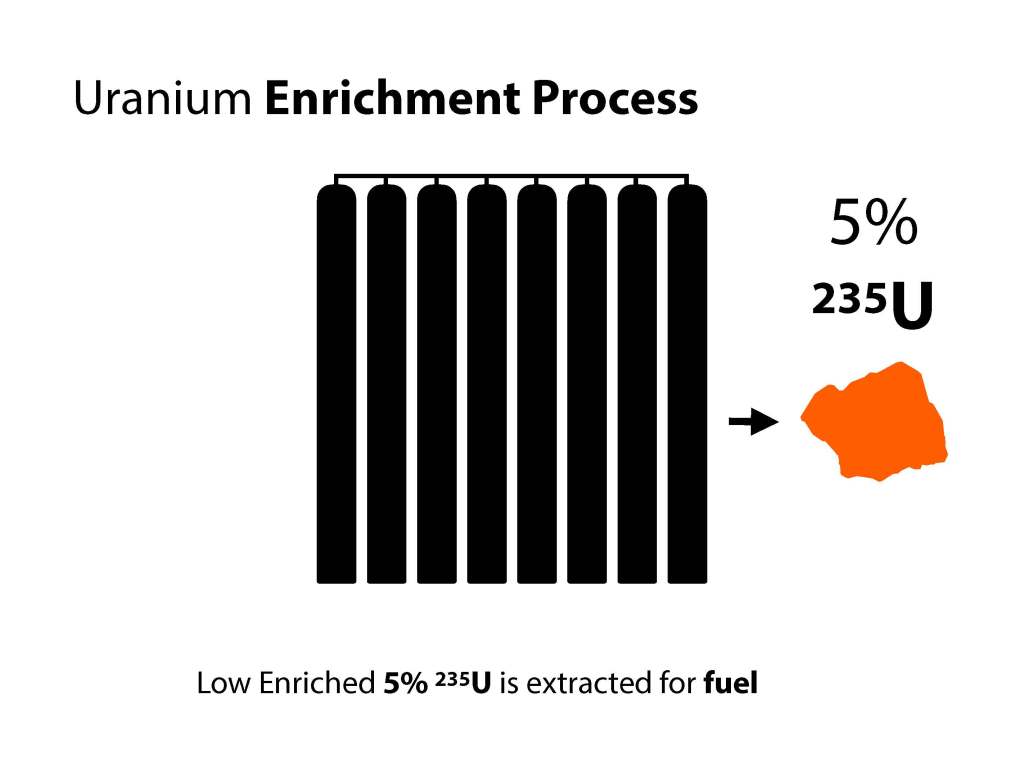
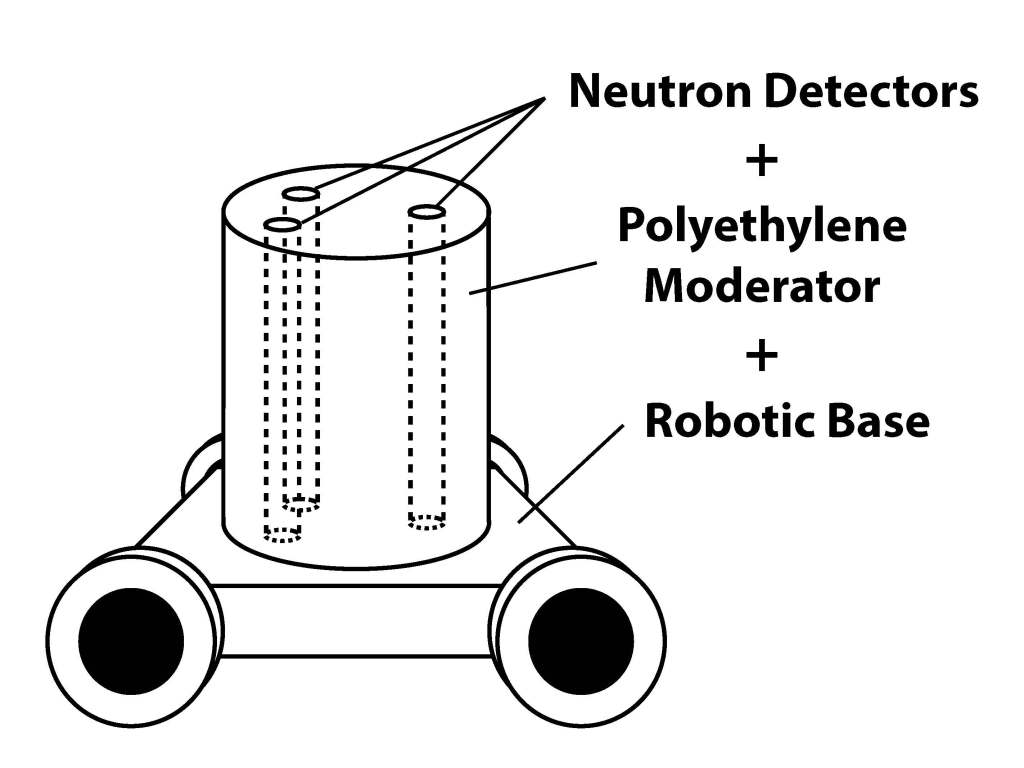

Students choose a topic that they are passionate about and think often suffers from misunderstanding: there are many aspects that need help or improvement, but due to lack of clarity about the topic, not enough is being done about it. To explain the topic, students create a visual story that helps convey a deeper understanding of the topic, provides awareness, reveals unknown aspects of the topic, uncovers needs, and makes areas for improvement evident to persuade your audience to take action.
Project 6: Show and Tell (Digital Report)

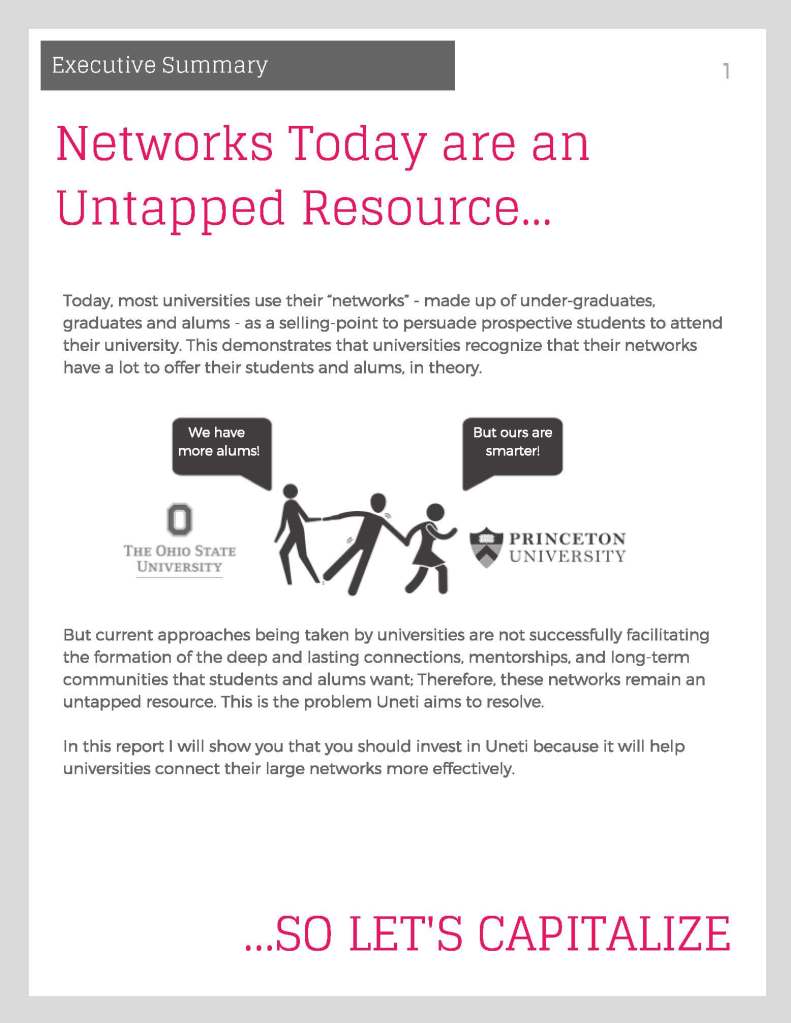

Students create a visual report to communicate insights and discoveries from “Explaining What Data” Project to a client. First, students determine what the goal of the visual report is, for example: apply for a summer internship, explain the topic, show a new point of view, convince, pitch a proposal to obtain funding or start a start-up, etc. The report should be a standalone piece and make sense without them explaining it. The report should be 60% visual and 40% text, and it should evidence learnings from the course (principles, process, etc.) as well as demonstrate creativity and visual skills to communicate a complex topic.
