
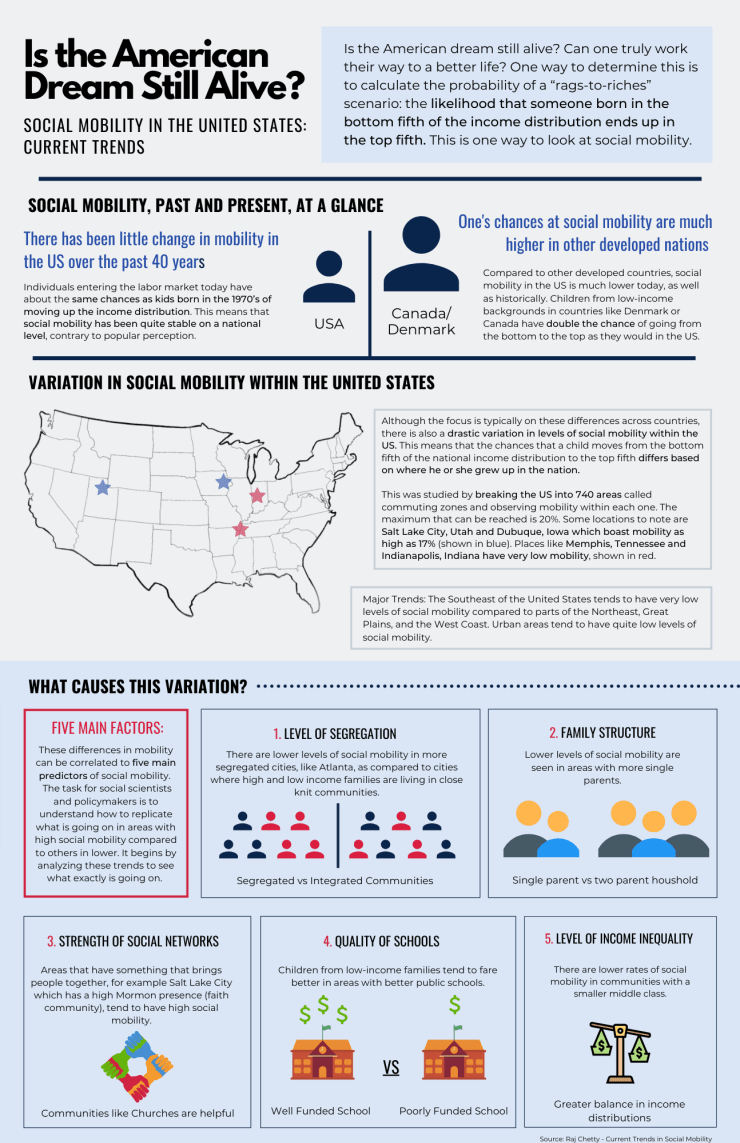
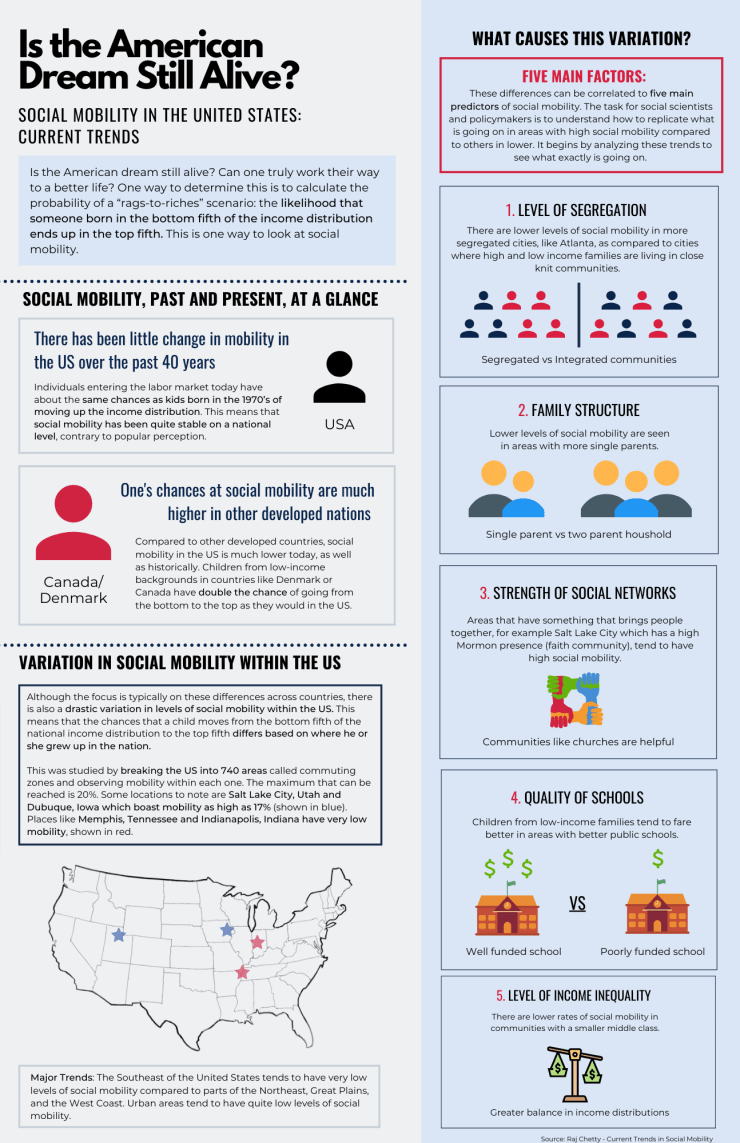
I realized that I really wanted to highlight the “What Causes This Variation” section, so I tried to do that in the first one by keeping my design relatively the same and adding a background color for emphasis, and in the second design by making that section a column instead. Which do you guys like better, version 1 or version 2? Thanks so much for your feedback!

Version 1: This is a really amazing piece so there is truly very little I can critique. I notice that your title relating to Canada and Denmark is higher than the USA one, but given the differing sizes of the icons, I attribute this to your visual representation of higher mobility. One tiny tiny thing, the ’s’ in years is a different color! It also seems as though you might have bolded certain phrases in the text throughout the piece, but those are very hard to differentiate. Perhaps you could try a different color or maybe even a different font size? Visually, this whole thing is just beautiful and so aesthetically pleasing. I really like the colored backgrounds, this looks like something out of the pages of a reputable political magazine. Your Five Main Factors section has great content. It introduces quite a few more colors to the pallet of the piece, and given that they are more decorative/associative than informative on their own, maybe you could color doctor them to fit into the color scheme. Overall, this is truly great!
Version 2: The thing I see here is that since you’ve given your two main sections similar entry points and the same amount of space, it’s implying that they are of equal importance, whereas I see the leftmost information as the core of the piece with the right column as your ‘extra’ so to speak. I really enjoyed the variation that you provided with your spacial breakdown in the first version, and this feels simplified to just the two columns. This version is still great, I like your color differentiation in the social mobility section, but I find myself drawn much more to the first version. I think it’s the best one I’ve seen in the class so far!
LikeLike
I really like how the second version looks. It’s nice to have the different sections distinguish by the background color. Another option for being able to present the topics efficiently is turning the infographic horizontal instead of vertical and separating the design into two standard magazine pages. The color choice is great and I think your entry points work well. I didn’t feel lost while reading the infographic and it was engaging in a way that didn’t make me feel overwhelmed by the information.
LikeLike