
The art of creating infographics is the genius process of translating information into a visually appealing and easy to follow storyline that gets the message across. As technology progresses, so does our capability to create better infographics. Many companies have created software that facilitates our ability to create meaningful and effective infographics. However, there is more than meets the eye when developing infographics.
“Don’t judge a book by its cover” is a quote we are all familiar with. This explains the concept that a lot of great things may be hidden behind misleading covers. When it comes to infographics a cover is all you get. You have to take many things into consideration and take many steps to reach an effective infographic. You have to make complex concepts understandable, determine your audience, and let the data tell its story all while creating an engaging narrative that’s easy to follow. Structure becomes a major key component at the early stage. Determining where and what data you will be incorporating and in what structure (grid type, hierarchy, etc.) can make or break your creation. Visuals alone require a lot of consideration. You want to create a color theme that doesn’t overwhelm the reader or distract them from getting the information. In this post, I will be analyzing some infographics and discussing what makes or breaks them.
TWITTER MOMENTS
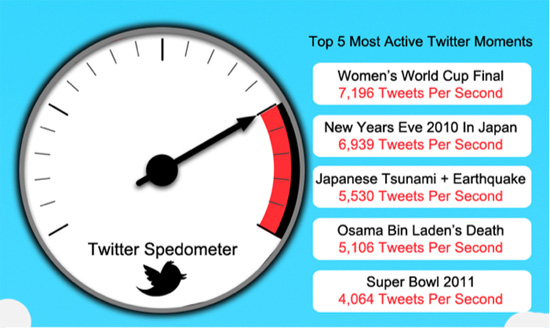
This infographic talks about the top 5 most active twitter events. This is on the simple side of the spectrum when it comes to infographic information. Seems like a relatively easy task. We can see in the image above that the creator did a couple things right. There’s a clear use of grid where the speedometer image is on the left and all of the text is aligned on a single column on the right. The infographic doesn’t seem cluttered and it’s easy to navigate. Another thing they did right was creating a color theme. (Although not the most visually appealing in my opinion.) The creator still creates a color theme of red and blue. You typically want to limit your color options to a minimum in order to prevent overwhelming the reader.
Admittedly, this infographic goes wrong in some respects. The title is perhaps the most important part of an infographic as it is used as a hook to draw in the reader’s attention. It has to be clearly highlighted so the reader immediately recognizes what he/she is looking at. Here, the title is not clearly highlighted as not even the font size is changed from the individual event names. Another place this goes wrong is it prevents the data from telling its story. Instead the number of tweets and event names are simply thrown in. There is no clear connection from the data to the speedometer on the right. Lastly the choice of making the number of tweets in red font is rather distracting. Additionally, it creates a negative feeling towards that particular data set, as we usually correlate with the color red.
INCOME/OUTCOME
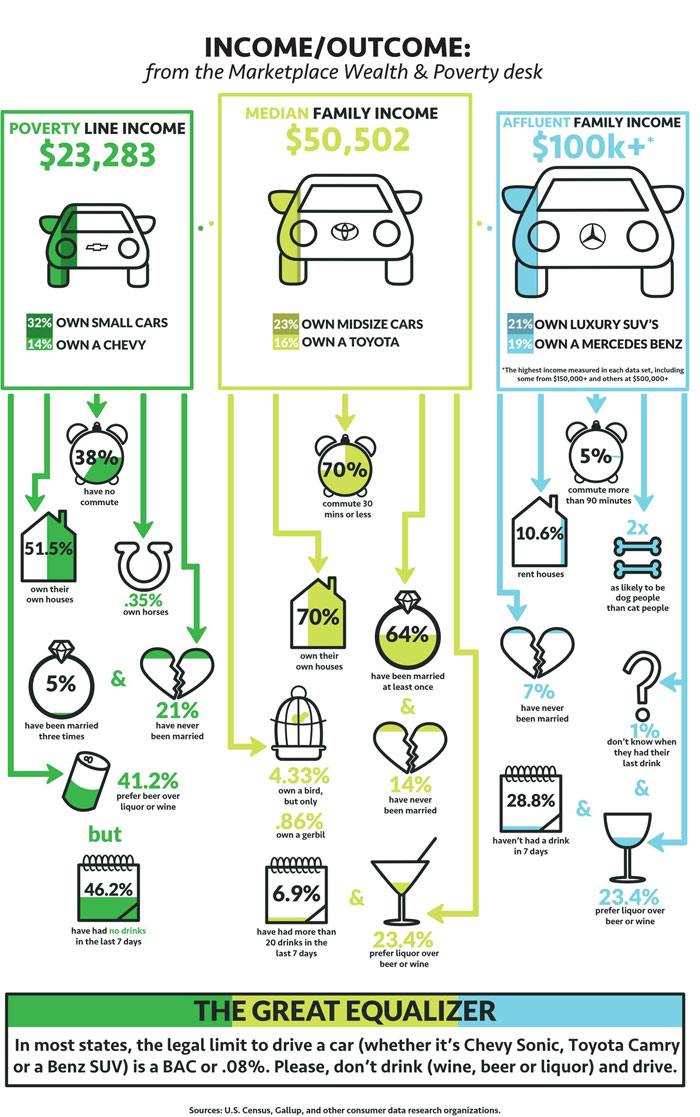
This example is a lot more visually appealing. They make a better use of color in order to distinguish the different economic classes. They also do a really good job of depicting the data with the aid of visuals. The title is clearly highlighted and easy to spot. Definitely creates a good entry point.
Where this infographic goes wrong is in the narrative. There is no clear story the data is telling besides different statistics of the three income classes. At the end of the infographic we are thrown a conclusion talking about driving and the legal Blood Alcohol Level (BAC) required to do so. In conclusion, we are thrown a lot of data points and statistics that seem rather random and arrive at a message about BAC without any clear storyline about how we got there. This only leaves the reader confused and not having learned anything along the way.
CAMERA V. SMARTPHONE

This is in my opinion the best of the examples I have provided in this post. Right away just glancing at this infographic one is immediately pleased with the color theme choice. The colors are complementary which creates a balanced and relaxed environment. It’s also important to note that no text is hard to read due to color choice. The text is still properly highlighted and legible. The title is significantly different from any other text in the infographic and we can easily distinguish it as so. The grid is also clearly laid out and all of the information seems properly organized. Despite there being a lot of information, a lot of useless text is removed and leaves us with the essentials. Furthermore, the narrative is clearly present throughout the whole poster. From the title alone we are informed that we will be reading about the differences between cameras and smartphones when it comes to photography. Throughout the poster we see this theme with all of the statistics clearly being compared between both types of devices. Ultimately this infographic includes all of the important elements of infographics and utilizes them effectively. You can easily distinguish the difference in craftsmanship between the previous two examples.
